


In view of my recent series on linearity and other technical topics before that, the time is perhaps now ripe to discuss audio measurements.
I will focus on what is probably familiar to most audiophiles and hopefully even more familiar to equipment designers: frequency response plots!
A few days ago, I was designing some audio electronics in the deepest corner of my cavely lab and was testing the performance of the prototype with a rather expensive transformer, intended for audiophile use. Something wasn’t right so I ended up testing a bunch of transformers I had lying around the bench, measuring the transformers on their own (rather than installed in the product).

The results for this particular and expensive unit were shockingly bad, but the severity of what looks like “a bit of a ripple around 20 kHz” would be better appreciated if we change the display from 10 dB per vertical division to 1 dB/div, all other settings maintained as before.

This is a 20 Hz – 43 kHz plot and the 1 dB/div resolution reveals a dramatic resonance, caused by unintentional aspects within the transformer: leakage inductance and winding capacitances. An unfortunate combination of such parameters renders this massively built transformer practically useless for serious audio use.
The difference in the display between the 10 dB/div and 1 dB/div settings demonstrates the first thing to look out for when trying to correlate measurements with performance: what are we actually looking at? Is a tiny blip in the middle of the plot really as tiny as it looks, or are the scale and smoothing settings “artistically selected” for a more flattering display?
This leads to a second question: all transformers contain the aforementioned unintentional components and therefore, they must all exhibit resonance at some frequency.

But how is the above plot, of a different, better transformer, possible?
Where is the resonance? As mentioned earlier, these plots are all 20 Hz – 43 kHz in a logarithmic scale along the horizontal axis. Any anomalies occurring below 20 Hz and above 43 kHz are not going to be displayed on this plot! We could pretend they are not there, since anything outside this frequency range is outside the traditional concept of the “audible range” anyway. But as mentioned in Issue #107, frequency response errors outside the 20 Hz to 20 kHz range could cause phase response errors within this range!
In practice, excellent audio transformers are designed and constructed in ways that push these resonances so high up in frequency, and compensate for them to derive a gentle roll-off rather than out-of-control peaks and dips, as to be of little to no practical consequence in audio applications. Such transformers can exhibit a smooth frequency and phase response over an even wider range than 20 Hz – 20 kHz.
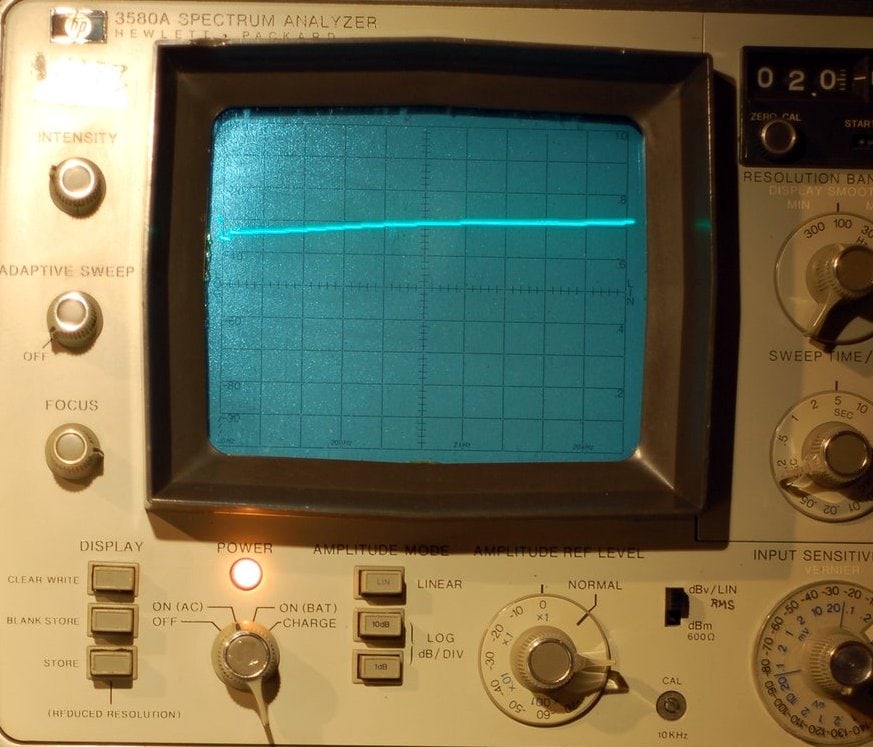
That same transformer maintains a respectable plot even at 1 dB/div resolution, being 0.5 dB down at 20 Hz, correctly terminated… wait… did I just say “terminated”…?
![]()
Several years ago I found this cheap single-ended output transformer in a vacuum tube table radio made behind the Iron Curtain. Nothing to expect outstanding performance from. So, here’s how to lie with measurements:

Isn’t this one of the most outstanding single-ended transformers ever?
Begs to be used with the finest example of a 300B output tube…or not?
This was at 10 dB/div, terminated in a 1 megohm resistor, which is to say, nowhere near its real-life operating conditions.

This is the same but 1 dB/div. Already a bit less flattering. In actual use, this output transformer would be expected to drive a loudspeaker. So we should try terminating it in a more realistic loudspeaker impedance value, say 8 ohm, 1dB/div:

Oops! How about 4 ohm, 1 dB/div?

We’re 5 dB down at 20 kHz, and 3.5 dB down with an 8 ohm load. In an actual circuit, driving an actual loudspeaker, this is likely to be slightly worse, but given what this came from, it is certainly better than expected.
A 50 Hz to 8 kHz bandwidth was a typical design aim for AM table radios in the late 1940s. But we would most likely be able to sell it for 10 times as much if we conveniently set the analyzer for 10 dB/div, still keeping the 4 ohm termination:

Still 5 dB down at 20 kHz, but looks better, doesn’t it?
But what is so special about audio transformers? Can’t we just use a much cheaper power transformer as an output transformer?
Audio transformers need to operate over a very wide frequency and dynamic range. This calls for special core materials, special winding techniques, special insulation materials, tight parameter control and attention to detail.
There are certain power applications which may have similar requirements, but audio is on a whole different level. As an example, this is the 1 dB/div plot of a special industrial transformer I designed a while ago:

Not really audio-grade, but maybe acceptable in a guitar amplifier, though the cost might put you off. It does what it was designed for very well, and it certainly isn’t audio.
As for the average off-the-shelf, mass-produced power transformer? Judge for yourself (1 dB/div, 8 Ohm termination)!

0 comments