


Do you want to make adjustments to your speaker’s in-room frequency response and quell those unwanted pesky peaks and dips? Do you understand how equalization (EQ) works but have always struggled to understand the spec of “Q” and what part it plays in our adjustments? Do you have an equalizer or receiver with room correction capability?
Are you an audiophile who also likes to take photographs?
If you answered yes to any of these questions then you are in the right place.
In this article we will look at how to make insightful Q adjustments to our frequency response curve that will benefit your sound. By the end, your understanding of the effect of these adjustments should allow you to make them with judicious confidence rather than inadvertently mess up your sound. And, if you are someone who also enjoys photography, you will likely find our included ready-reckoner memory aid to be helpful in making adjustments with ease and meaningful impact to your sound.
For those who might need an introduction or refresher, what is Q? Most equalizers are graphic equalizers, the type found anywhere from Windows Media Player and Apple Music to the standalone units used by recording studios, DJs and in some home audio systems. A graphic EQ will boost or cut the volume level of a fixed selection of frequencies, usually in one-third-octave ranges. A parametric EQ, on the other hand, can boost or cut any frequency within its control range, and also adjust the bandwidth – or Q – of the selected frequency range. (Technically, Q is the ratio of center frequency to bandwidth.)
Graphic equalizers are intuitive. They’re familiar ground for us and are visually representative of the changes we make in the adjustments. You simply boost or cut a pre-set frequency level to taste and literally see a “graph” of the adjustments by the positions of the sliders. Parametric EQs are more advanced – they may allow us to choose from a much greater choice of specific frequencies we want to zero in on.
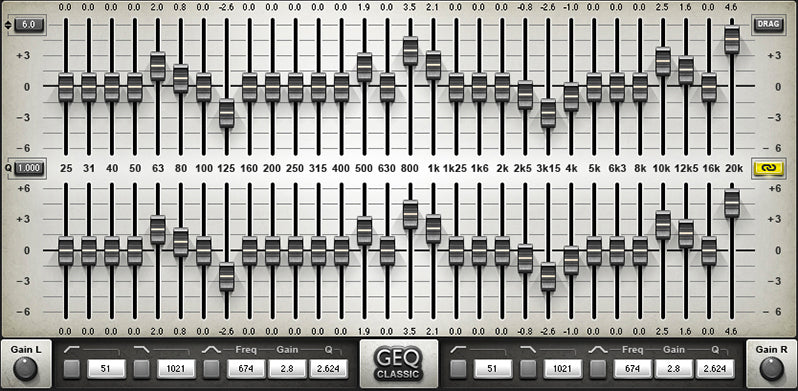
Waves Audio GEQ Graphic Equalizer software clearly showing the visual nature of the position of the EQ controls. From the Waves Audio website.
Once you have selected your chosen frequency (or octave) you want to edit, this becomes the center of your Q bandwidth. The Q number you choose selects how wide or narrow the bandwidth is stretching out from that center point. You may then use a milder or a greater amount of boost or (often more practically) cut as you increase or decrease the dB level of that Q bandwidth respectively. Parametric EQ may be less easy to visualize unless you have an on-screen display which shows your curve as you edit it in real time – but they are far more flexible and powerful in their refinement of your edits. You can operate with more surgical precision instead of less.
Let’s say we have a problem with a peak in our in-room frequency response at 500 Hz. We could choose to cut the volume of a slice of one octave in width, but taking 500 Hz as our problem center frequency will encompass double that amount going up in frequency, and half that amount going down in frequency. (Going up an octave in pitch results in a doubling in frequency and vice versa – a note played an octave above A 440 will have a frequency of 880 Hz.) So, if we want to make adjustments which cover a one-octave range centered at 500 Hz, we will be effectively looking to alter a width of frequency from 1 KHz (double 500 Hz) down to 250 Hz (half of 500Hz). Our Q factor for this one-octave slice of bandwidth can be given a value of Q 1.4. How is this derived? Here’s a quote from UK sound contractor Astralsound:
“Q is a relation of bandwidth. The number of octaves (or fractions of an octave) over which the signal is affected by boosting or cutting.
In EQ circuits, bandwidth and Q describe the same thing, but use different (and inverse) scales: the higher the Q, the lower the bandwidth, and vice versa. The range of possible adjustment can run from about 1/60 octave (Q ≈ 90) to about 3 octaves (Q ≈ 0.4).
Bandwidth is derived from the points on the EQ curve that are 3dB above or below the amount by which the central frequency has been cut or boosted. The center frequency is at the midpoint (in octaves) between the lower and upper frequencies: if the bandwidth is two octaves, the center frequency is one octave above the lower frequency, and one octave below the upper frequency (e.g., 1 kHz lower, 2 kHz center, 4 kHz upper).”
But let’s say we don’t want to affect such a wide part of the frequency range, which, in fact, is likely to be the case – boosting or cutting all those frequencies by, say, 3 dB, could likely create too much of a honky or muddy sound in the midrange. Purely as an illustration: in the case that the range where female vocals reside needed to be boosted a little, maybe just 1 dB would help. Even so, you might then find then that there is too much snare drum snapping across the mix compared to before your adjustment, but you still want the female vocals to be a little more prominent. Click on this link for an interactive chart of the frequencies of vocals and musical instruments.
What can you try?
This is where narrowing the width of the Q value may help us to be more specific in our edit. Instead of spanning a one-octave range, which would affect the fundamental notes of the snare, we could try half an octave range, from 375 Hz to 750 Hz. We still have 500 Hz as the center frequency, but now half of the bandwidth than before. Our Q factor for this half-octave slice can be given a value of Q 2.8.
If we wanted to make a narrower adjustment still, we could make a quarter of an octave adjustment with a Q of 5.6, or an eighth-octave with a Q value of 11.2, or sixteenth at 22.4 and so on. The higher our Q number, the narrower our bandwidth adjustment is, thereby allowing for a more specific edit of whatever instrumentation and vocals fall in that chosen frequency range. Or in other words, the higher the Q, the fewer frequencies are affected.
But hang on a minute. What if, conversely, we want to make an entirely different “edit” which affects a wider two-octave bandwidth range? Let’s say we want to widen the bass extension into the lower frequencies with 60 Hz as our center frequency. For a two-octave Q bandwidth, we halve our one octave Q factor of 1.4 down to 0.7. (Note: I’m not suggesting that you should make this adjustment. It just serves to provide an example of what varying Q bandwidths cover within their frequency response.)
Now this is where the photography buffs among you may have recognized a pattern with our Q numbers, and how they share a pattern of numbers that may be oh-so-familiar to you, the dear reader, if you use a camera. The idea is that if you already know your f-stop numbers you also already know your Q numbers. You can simply double them and this halves your Q bandwidth.
E.g., 1.4 to 2.8 doubles the f-stop number (but we’re not talking the amount of light or physical aperture, rather just literally doubling the familiar f number). This is then the same as our Q. 1.4 to 2.8 which has halved our Q.
Here’s a useful chart:
Double Your F-Stop Number to Halve Your Octave Q Bandwidth:
| OCTAVES | Q | f -STOP |
| 2 | 0.7 | 0.7 |
| 1 | 1.4 | 1.4 |
| 1/2 | 2.8 | 2.8 |
| 1/3 | 4 | 4 |
| 1/4 | 5.6 | 5.6 |
| 1/6 | 8 | 8 |
| 1/8 | 11.2 | 11 |
| 1/12 | 16 | 16 |
| 1/16 | 22.4 | 22 |
What this means is that if you simply just remember that a one octave range has a Q of 1.4, you then can double your already familiar f-stop number (not aperture [1]) or Q number to halve your octave. You can narrow the bandwidth as much or as little as is necessary to fine tune your frequency curve adjustment! Just as with light, as you narrow your aperture by squinting, you can see things in the distance more sharply. Similarly, as you narrow your Q, you can make sharper adjustments to your bandwidth with increasingly refined specificity.
You may of course want to make adjustments of Q numbers not on the chart, but generally, this selection of Q numbers may readily cover the bandwidths you’ll likely want to use to make your adjustments with.
Here is a link to a calculator that allows you to enter the data for the lower and higher frequencies you wish to control, and it will calculate the center frequency and Q number for you:
https://www.astralsound.com/parametric-eq.htm
Then to calculate your Q value, subtract the lower frequency of your undesirable peak F2 from the upper frequency of that peak F1.
F2 – F1
So, using our earlier example, that would give us 1,000 Hz – 250 Hz = 750 Hz
Then divide the center frequency F3 by the result.
F3/(F2 – F1)
500 Hz/750 Hz = .67, so a Q of 2 octaves would be adequate for what we would want to apply. If this turns out to be too wide in its audible effect upon other instruments in the mix, we could try using one octave of 1.4 or less.
Using the knowledge as someone familiar with the f-stop scale of a camera can help you quickly remember your Q numbers and visualize the range of bandwidth you are intending to apply within your frequency response curve.
With some AV receivers, using their built-in software or control apps, you can actually see the EQ changes you make, and how smooth the resultant curve is (or not), and as you alter the Q bandwidth, this too can be seen in a very helpful and relatable way. One of the great features with Yamaha’s A/V receivers, as an example, is the ability to see and edit parametric EQ with editable Q values. This is a very powerful sound-tailoring feature that hopefully will be adopted by more of the industry. Why? It’s uncommon for an EQ to offer the exact frequency you need to edit as dictated by your measured room response. Until then, perhaps you are now more empowered to make the adjustments you want to with insight and confidence.
In a coming article we will discuss the practicalities and limitations of using EQ.
[1] Remember, we’re not working with light here. I say we’re not doubling the amount of light as we’re just using the f-stops as a reference for what our Q numbers are. This is because, if you double the f aperture to 2.8 it becomes half the amount of light at f4 and half again by f5.6.
So, to know your Q numbers, just double the f number.
Header image: graph showing parametric equalization. Courtesy of Wikimedia Commons/Matias.Reccius.
0 comments