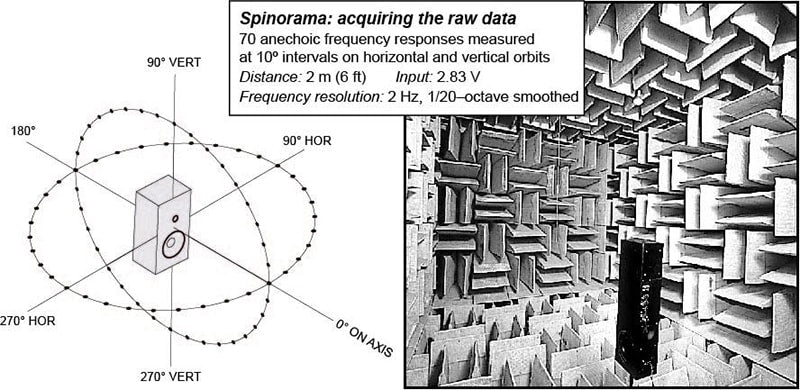
In our first installment of this two-part series examining Spinorama data (Part One ran in Issue 155), we looked at the information represented by the plots at the top of an example Spinorama graph, and what this information reveals about a speaker’s performance. These plots are: On-Axis response, the Listening Window, Early Reflections, and Sound Power. Here in Part Two, we’ll look at the plots at the base of the graph: the Sound Power Directivity Index and the Early Reflections Directivity Index (DI), both of which serve to further lift the veil on a loudspeaker’s sonic behavior, and critically, what all this means for us as discerning listeners and potential customers. First, though, let’s briefly recap what Spinorama is. Spinorama is a method of loudspeaker measurement pioneered by Dr. Floyd Toole. This method helps the listener by revealing a speaker’s performance characteristics, and their correlation to sound reproduction. Spinorama produces a set of data derived from measuring a speaker from multiple positions, with microphones measuring the speaker’s output through 360 degrees around the speaker. The measurements are done in an anechoic chamber. The resulting computer-processed Spinorama charts are based on measurements of the speaker’s frequency response at 70 different points, starting on axis, and then at each 10-degree angle around the speaker both horizontally and vertically. The difference between these curves and normal anechoic frequency responses is that they have been selected and processed to reveal aspects of loudspeaker performance as they are likely to be heard in typical listening rooms. Bumps and ripples that are evident in all of the curves are strong indicators of system resonances, which color the sound, modifying the timbre of voices and instruments. Smoothness is the first requirement.
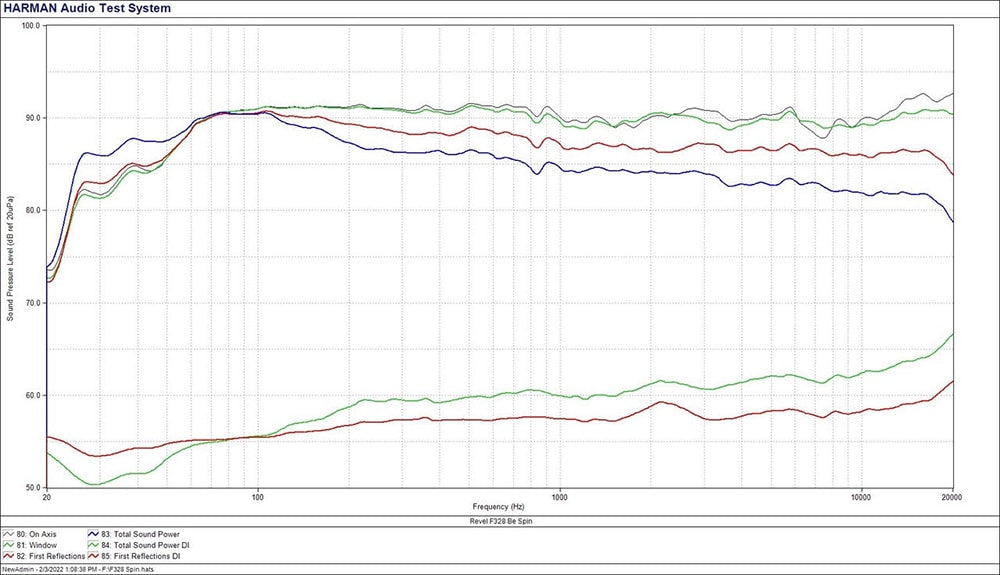 Spinorama chart of a Revel Performa F328Be loudspeaker. Image courtesy of Harman International.
The results of countless double-blind listening tests indicate that flat and smooth On-Axis and Listening Window plots are generally desirable. However, keep in mind that recordings and movies are not always consistent in spectral balance, especially in the bass region, so it is not uncommon to make small “tone-control” adjustments from time to time. Overall, good Spinorama measurements have been shown to correlate highly with listener loudspeaker preferences among listeners with “normal” hearing, which includes about 75 percent of the population. Even moderate hearing loss causes increased variations in sound quality judgments – opinions are not reliable. Sadly, this is an occupational hazard in many industries (and recreations), including audio professionals and musicians. As stated on page 15 of the online document, “Interpreting Spinorama Charts” by Manny LaCarrubba of Sausalito Audio: “The higher the directivity index, the more directional a speaker is. That is to say that more of the speaker’s energy output is biased forward. Virtually all loudspeakers are omnidirectional (DI = 0 dB) at low bass frequencies, exhibiting a directivity index that slowly rises with frequency, often reaching or exceeding 10 dB at 20 kHz. How smoothly the DI changes over the frequency range is a significant factor in how a loudspeaker sounds in a room. Reflected sounds should resemble the direct (on-axis/listening window) sounds in timbre, otherwise they draw attention to themselves. DI curves that show strong discontinuities indicate design flaws.
Back in 1985 – 1986 Dr. Toole reported that resonances and directivity flaws are readily heard in monophonic (single speaker) listening comparisons, but less so in stereo. In 2008, Olive, Hess and Welti confirmed the finding and observed even less awareness in multi-channel reproduction. It may not seem obvious, but hard-panned left or right stereo sounds are monophonic, and in multichannel programs the (monophonic) center channel delivers the featured artist, and most of the on-screen action in movies and TV. The moderately wide dispersion mid-frequency DI common with forward-firing cone/dome speakers appears to be desirable for stereo reproduction. Stereo is fundamentally a directionally and spatially compromised format – it matters less in multichannel systems (with a higher proportion of direct sound arriving from many directions). The measurements can help us in assessing how accurately a speaker may reproduce its source material, or if it is prone to anomalous resonances and peaks in output. This alone goes a long way in helping to identify a good-sounding speaker. Back to the chart in the illustration. At the bottom are two important frequency response curves which are calculated based on information already obtained from previously plotted measurements. The second (lower) green plot is the Sound Power Directivity Index. This “classic” DI is arrived at by calculating the results of the Listening Window minus the Sound Power plots. This is useful to look at because many of us want to enjoy having good-quality sound in more than one seating position, on a sofa for example. Perhaps the easiest “at a glance” way of determining how directive the sound is, is by examining how steep the slope is. The lower red plot is the Early Reflections Directivity Index, and this is simply derived as the difference between the Listening Window and the Early Reflections graphs. This is a metric invented for Spinorama when it became clear that the early reflections were a powerful indicator of what listeners hear in small listening rooms. If we see a response with little slope to it, that means the speaker has little directivity. What this information helps you to determine is, what amount of directivity you’d want for your personal tastes and room. For example, you may have a room with a lot of hard reflecting surfaces like tiles, large windows, patio doors, or glass cabinets. If so, you may prefer a DI with a higher slope on this plot, meaning the speaker will deliver a higher ratio of direct to reflected sound. Conversely, if you have a more absorptive room with things like carpeted flooring, bookshelves filled with books, heavy curtains, and no open spaces into other rooms, you may enjoy speakers with a lower DI. The steeper the upward slope, the more of the forward directivity of those frequencies you will hear at the listening position.
 Revel Performa F328Be loudspeaker in various finishes.
All of this information may seem a little overwhelming at first, and it’s true to say that ultimately there is a gamut of preferences as to what individual listeners may prefer to hear. (Personally, I enjoy a bright and focused sound and have a particular appreciation for dual-concentric loudspeaker drivers but I completely understand that is not for everyone, and there are of course many approaches to high-quality sound reproduction when it comes to loudspeakers. I have also owned some dual-concentric speakers in the past that were not as good as the ones I have today – though I haven’t done any Spinorama measurements on them yet!) However, when looking at Spinorama information, there are many correlations between the plotted speaker characteristics and what many people consistently find more appealing in the sound of loudspeakers in blind listening tests. According to Dr. Toole, in the real world the problem is that competently-done measurements are unbiased and accurately repeatable, whereas the kinds of subjective evaluations most people (including reviewers) are able to do are biased and not repeatable at different times and places – a true dilemma! (It leads to endless internet discussions, though.) Much of the rigor in testing and in verifying the attributes of loudspeaker sound that listeners generally agree upon can be read about in detail in Dr. Floyd Toole’s publication, Sound Reproduction: the Acoustics and Psychoacoustics of Loudspeakers and Rooms, now in its third edition. Below is a link to an informative seminar conducted by Dr. Toole in conjunction with the CIRMMT Distinguished Lectures in the Science and Technology of Music. httpv://www.youtube.com/watch?v=zrpUDuUtxPM The video itself is over an hour long but it is highly insightful and outlines decades of pioneering research, and I recommend you watch it right now! In my humble attempt at oversimplification, here are some helpful bullet points garnered from the seminar:
- The Early Reflections curves will look very similar to the On-Axis and Listening Window curves in good-sounding speakers.
- The nearer the Listening Window curve matches the On-Axis response, the better the sound will be for those seated in the listening area.
- Large peaks and troughs in the graphs usually portray undesirable resonances or uncontrolled frequency response deviations in less-well-designed speakers.
- The higher the Directivity Index, the more directional the speaker will be.
Of course, there are limitations with Spinorama information. The main thing to keep in mind is that every room will massively influence the sound heard from the loudspeakers, each room imposing itself on the sound in its own unique way. Additionally, it’s important to remember that the Spinorama data itself is collected from the speaker’s behavior when measured in an anechoic chamber, a controlled acoustic environment which is very different from any room in which a speaker will be listened to. That said, it would be impossible to collect the extremely useful Spinorama data any other way. (Others have attempted Spinorama measurements in rooms other than anechoic chambers and have had to add caveats to their measurements as a result.) You could perhaps think of the Spinorama data as akin to the manufacturer’s specifications for a vehicle’s mileage ratings. When you drive your car, it’s likely that the routes you drive on won’t match the manufacturer’s test conditions. Yes – your mileage may vary. But this does not invalidate the value of the specifications provided by the car’s manufacturer, in the same way that Spinorama measurements will be a valid indicator of a speaker’s performance. One could hope that the use of Spinorama will become more prevalent in the industry and among reviewers. An experiment worth trying out, which I have found to be very supportive of the value of Spinorama data, is to listen to a demonstration of, say, three or more different sets of speaker pairs (if the audio salon will accommodate you). I find it’s easier to compare just a few at a time, for the sake of recalling details and mental notes. (In an ideal world you would conduct the test under double-blind conditions to enable non-visually influenced assessments.) Take note of the speakers you like the most and simply rank them. When you return home, look up the Spinorama data for each, if it exists of course, and see for yourself if the best-sounding speakers conform to the Spinorama data indicating which would be best. You may be encouraged to discover that the speakers you enjoyed the most did in fact follow the desirable characteristics in their measurement plots, whereas those you disliked did not. I will have a little more to say about this experiment in a future article. As always, enjoy your listening-comparison experiments with music that is most familiar and well-known to you in its nuances, whether focusing on the vocals, drums, woodwinds, strings, or each in turn. It’s all part of striving towards a positive listening experience. It’s worth the proportionately small investment of time compared to the many years of listening pleasure you will likely derive from your speakers.
Header image: from Sound Reproduction: the Acoustics and Psychoacoustics of Loudspeakers and Rooms, third edition.